

The paper is structured around the gross domestic product, the balance of trade, the balance of payments, revenue collections, political conflicts, public debt, and the human development index of India, Bangladesh, and Pakistan.

The paper analyses the data mainly from the International Monetary Fund and World Bank Database sources regarding economic and social factors, and then ranks the three countries in social and economic development.
These three countries share an inextricable history and are founding members of the South Asian Association of Regional Cooperation (SAARC), the South Asian Free Trade Area (SAFTA), and the South Asian Co-operative Environment Program (SACEP).
Gross Domestic Product


The graph above depicts that Bangladesh’s GDP during the last ten years has grown from USD 115 billion to USD 302 billion in 2019, presenting an increase of 162%. During the same period, India’s GDP has increased from USD 1678 billion to USD 2869 billion, which is an increase of 71%. Pakistan’s GDP has also increased, from USD 179 billion to USD 278 billion, a 55% increase.
The analysis shows that the GDP growth percentage of Bangladesh was the highest, followed by India and Pakistan. However, the Indian GDP is much higher than Pakistan and Bangladesh combined. That comes as no surprise since India is part of BRICS, the world’s leading emerging market economies.
Trade as % of GDP

India is a mixed economy and the biggest exporter of pharmaceuticals and textiles; the graph shows that India’s 40-55% of the GDP relied on trade from 2010 to 2019. Pakistan’s 25-35% of the GDP relied on trade, according to the reports from the World Bank database, as the largest exporter of textile and cotton. It, however, has been in a trade deficit since 2003, mainly due to high imports of energy.
Bangladesh is one of the fastest-growing economies in the world; the country has pursued export-oriented industrialization. The % trade of GDP is around 35-50% during the year 2010-2019. It is the largest exporter of ready-made garments, trading with the European Union and the United States, but it still has a trade deficit because of the import of refined petroleum, raw cotton, and other goods and services from India and China.
COVID-19

COVID-19 has brought the deepest global recession in decades. While the final outcome is still uncertain, the pandemic will result in contractions across these three South Asian economies and developing countries. It will also do lasting damage to potential output and labor productivity. According to the World Bank-Global Prospects Reports, GDP in the South Asian region will contract by 2.7% in 2020 as pandemic mitigation measures hinder consumption and services.
In India, growth is estimated to have slowed to 4.2% in the year 2019 which ended in March 2020. Output is projected to contract by 3.2% in the year 2020/2021, while Pakistan will suffer a negative growth of -2.6% in years 2019-2020. Growth in Bangladesh will also slow down to 1.6% in 2019/2020 and is expected to decelerate markedly due to pandemic-related disruptions including mitigation measures and sharp falls in exports and remittance flows.
Balance of Trade

The above graph shows that all three countries have experienced a trade deficit during the last ten years. The trade deficit as percent of GDP of Bangladesh in 2010 was -5.7% which has increased to -6.1% in 2019. The trade deficit as percentage of GDP of India was -4.4% of GDP in 2010 but reduced to -2.7% in 2019.

The highest trade deficit as a percentage of GDP was Pakistan’s, -5.8% of GDP which further deteriorated to -10.2% of GDP in 2019. This also indicates that the economies of all three countries are highly dependent on imports, which affects the export-led growth of the economy.
Balance of Payments

Pakistan has reduced the number from -6% in 2017 to -4.8% in 2018, to -1.5% in 2019 of GDP as a result of a drastic reduction in imports and various government measures. India has significantly improved from -2.8% of GDP in 2010 to 0.329% of GDP in 2019; India’s current account position has remained mostly in a deficit, but in the last year, it has even turned positive.
The current account of Bangladesh has remained positive, except for 2011, and the last 3 years, in which it was in a deficit. Concluding, the current account balance position of India is comparatively better than that of Bangladesh and Pakistan. India’s stable balance of payments is mainly due to India’s lower trade deficits and decrease in imports, whereas Pakistan’s deficit has decreased because of increased remittances from expatriates.
Foreign Direct Investment and Remittances

Foreign direct investment (FDI) in all three countries has remained positive; in the case of Pakistan, however, the FDI % of GDP has decreased from 1.4% in 2010 to 0.797% in 2019. In India, the foreign direct investment, as a percentage of GDP, has only differed slightly between 2010-2019, approximately 1.7% of GDP. Bangladesh’s FDI saw a drastic decrease from 1.7% to 0.6%.
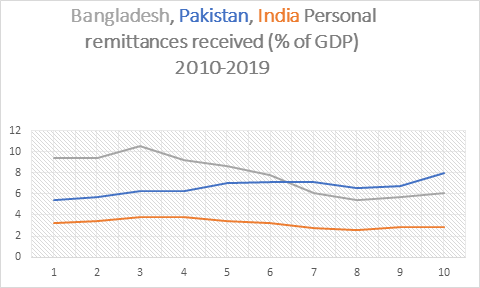
The foreign remittances received from expatriate workers, mainly living in the Middle East, have remained a source of overcoming the balance of payment deficit and trade deficit. In the case of Pakistan, remittances accounted for 5% of GDP in 2010 and increased to 7.9% in 2019. During this same period, India’s remittances from foreign workers went from 3.2% of GDP in 2010 to 2.9% in 2019. However, Bangladesh’s remittances of GDP have had a sharp decrease from 9% in 2010 to 6.06% in 2019.
Tax revenue as % of GDP

The tax revenue to GDP ratio of India has remained between 10%-12% of GDP, whereas Pakistan’s has been between 9%-11%. Bangladesh, on the other hand, has the lowest tax to GDP ratio, which is recorded between 7%-9%. The tax revenue of all three countries is generally low. Many countries, like Denmark and Israel, have their GDP dependent on tax revenues, but this is not the case with these South Asian countries.
Public Debt as % of GDP

Due to fiscal deficit and current account deficit, the public debt to GDP ratio of Pakistan has increased from 60% in 2010 to 85% in 2019, and has further increased to 87% in 2020. India’s debt to GDP ratio has increased from 66% to 72%, and further to 90% in 2020. Bangladesh’s debt to GDP ratio during the same period has remained 35%, and further increased to 39% in 2020.
Human Development Index
The Human Development Index or HDI depicts the quality of human resource development. It is based on relative weightage assigned to education, health, standards of living, and gender inequality of the people living in a country, region, or area. The analysis of HDI is based on the education index, health index, and standards of living, including the multiple poverty index and gender inequality index.
The human development index of Pakistan, Bangladesh, and India has increased by 9%, 14%, and 11% respectively during the last 10 years. Bangladesh has the highest increase in the human development index, and Pakistan the lowest. However, India has the highest number of years of schooling, that is, 12.2 years, while Pakistan’s is the lowest, being 8.3 years; Bangladesh is 11.6 years despite only gaining independence in 1973.
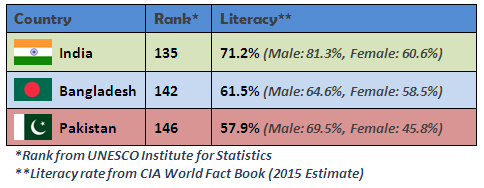
The gender inequality index ranking of Pakistan, Bangladesh, and India in 2019 was 135, 133, and 123 respectively. India has lower inequality as compared to the other two countries. The multidimensional poverty index (MPI) of India, Pakistan, and Bangladesh, is 0.123, 0.198, and 0.104 respectively, whereas the percentage of poverty in India, Pakistan, and Bangladesh is 27.9%, 38.3%, and 24.6% respectively. So the highest poverty, in Pakistan, and the least poverty in Bangladesh.
Pakistan is recognized as a country with low income, along with poor human development indicators. Climate change can cause negative growth in GDP for the workforce relying on agricultural sectors, and this could be risky for those associated with the agricultural sector. Heat and humidity can disrupt the productivity of labour.
The percentage of people living below the poverty line in Pakistan, Bangladesh, and India are 24.3%, 24.3%, and 21.9% respectively. India and Bangladesh have been two of the fastest-growing economies in the 21st century, with a growing GDP, good governance, and relatively mature democracy hence the ranking in the human development index.
Pakistan is facing internal challenges that make it difficult to compete with other South Asian countries; it has the lowest human development indicators in South Asia. The internal governance system is poor, which leads to poor economic growth. Moreover, its repetitive assistance from IMF and other foreign institutions causes the Pakistani Rupee to weaken.
Conclusion
The human development index shows that India stands best with 0.645 HDI and ranks 131 out of 189 countries, whereas Bangladesh and Pakistan rank at 133 and 154 respectively. Apparently, this is due to spending more on human resource development by India and Bangladesh compared to Pakistan.
India towers over its neighbors on all economic and most socio-economic indicators. Despite the violent events in 1971, Bangladesh outshines others in health, education, and social factors. Pakistan, which started with the best socio-economic life in 1947, has slipped on all its parameters. Unlike Bangladesh, it spends too much on the military and too little on social development.
The International Monetary Fund calculates Bangladesh’s economy growing from $180 billion to $322 billion by 2021. Bangladesh’s GDP growth rate in 2019 was 8.153%, India’s 4.181%, and Pakistan’s 0.989%, correlating with all this, Bangladesh is one of the fastest-growing economies in the world. Bangladesh is quickly moving to a high-value, knowledge-intensive society, with high urbanization.
If you want to submit your articles and/or research papers, please check the Submissions page.
The views and opinions expressed in this article/paper are the author’s own and do not necessarily reflect the editorial position of Paradigm Shift.
Mr Saif Ullah Khan is currently pursuing his BSc from Budapest Metropolitan University of Applied Sciences.